Geographic Information Systems
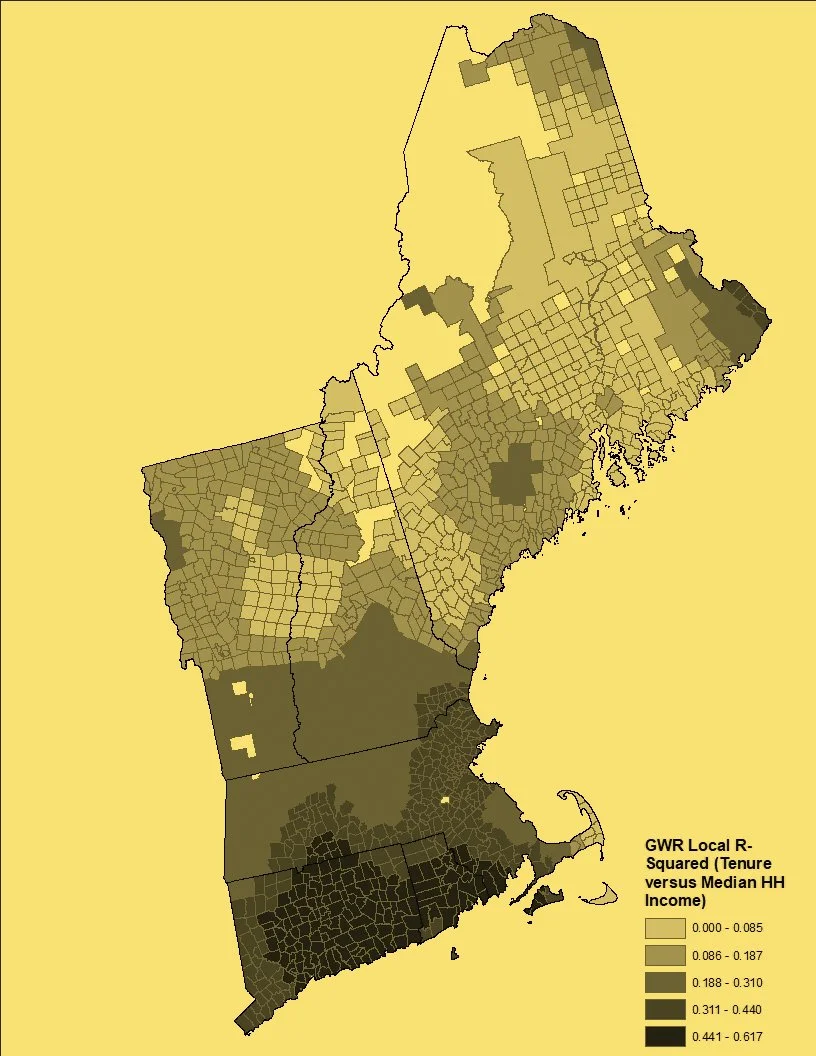
Teaching GIS
From Fall 2021 to Spring 2023, I had the inestimable privilege of serving as an adjunct assistant professor for the urban planning program at Columbia University Graduate School of Architecture, Planning & Preservation, my alma mater. I collaborated with an amazing instruction team in teaching Geographic Information Systems courses for planning, urban policy, and built environment analysis—emphasizing critical evaluation of sources and methods, purposeful visual communication, and spatial research design—using a variety of pedagogical approaches, including discussion-centered seminars and labs, project-based learning, and lectures.
Click here for more details.
GIS at NYCHA
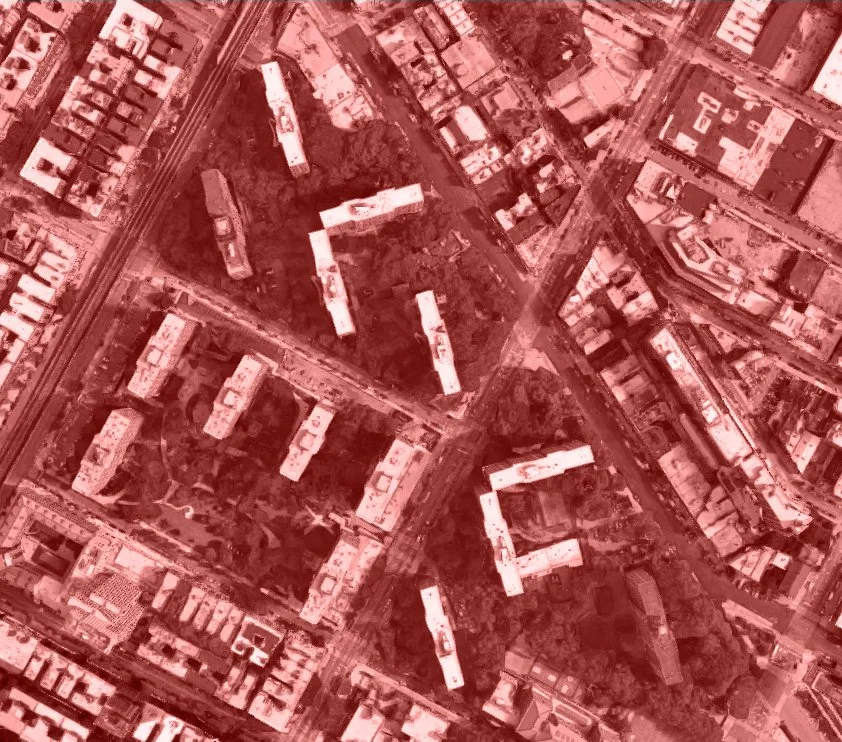
Upon receiving my Master of Science in Urban Planning in 2019, my first job was as the sole full-time Geographic Information Systems (GIS) analyst for the New York City Housing Authority (NYCHA), the largest public housing authority in North America. Working in the Performance Tracking & Analytics Department, I focused on GIS-related tasks in support of programs and initiatives across the Authority’s wide mandate.
Click here for more details.
Weedscapes: When Commercial Cannabis is Your Neighbor, URB. MAG., COLUMB. UNIV. GRADUATE SCH. OF ARCHITECTURE, PLAN. & PRES. at 10 (2023).
California became the first American state to legalize medical use cannabis in 1996 through ballot initiative, doing so without benefit of a comprehensive, statewide regulatory framework and setting off a two- decade cannabis industry free-for-all known as the Green Rush. Not until 2018 did California finally establish such a system for both medical- and recreational-use cannabis, finally positioning local governments to directly regulate cannabis-related activities through their zoning and other police powers.
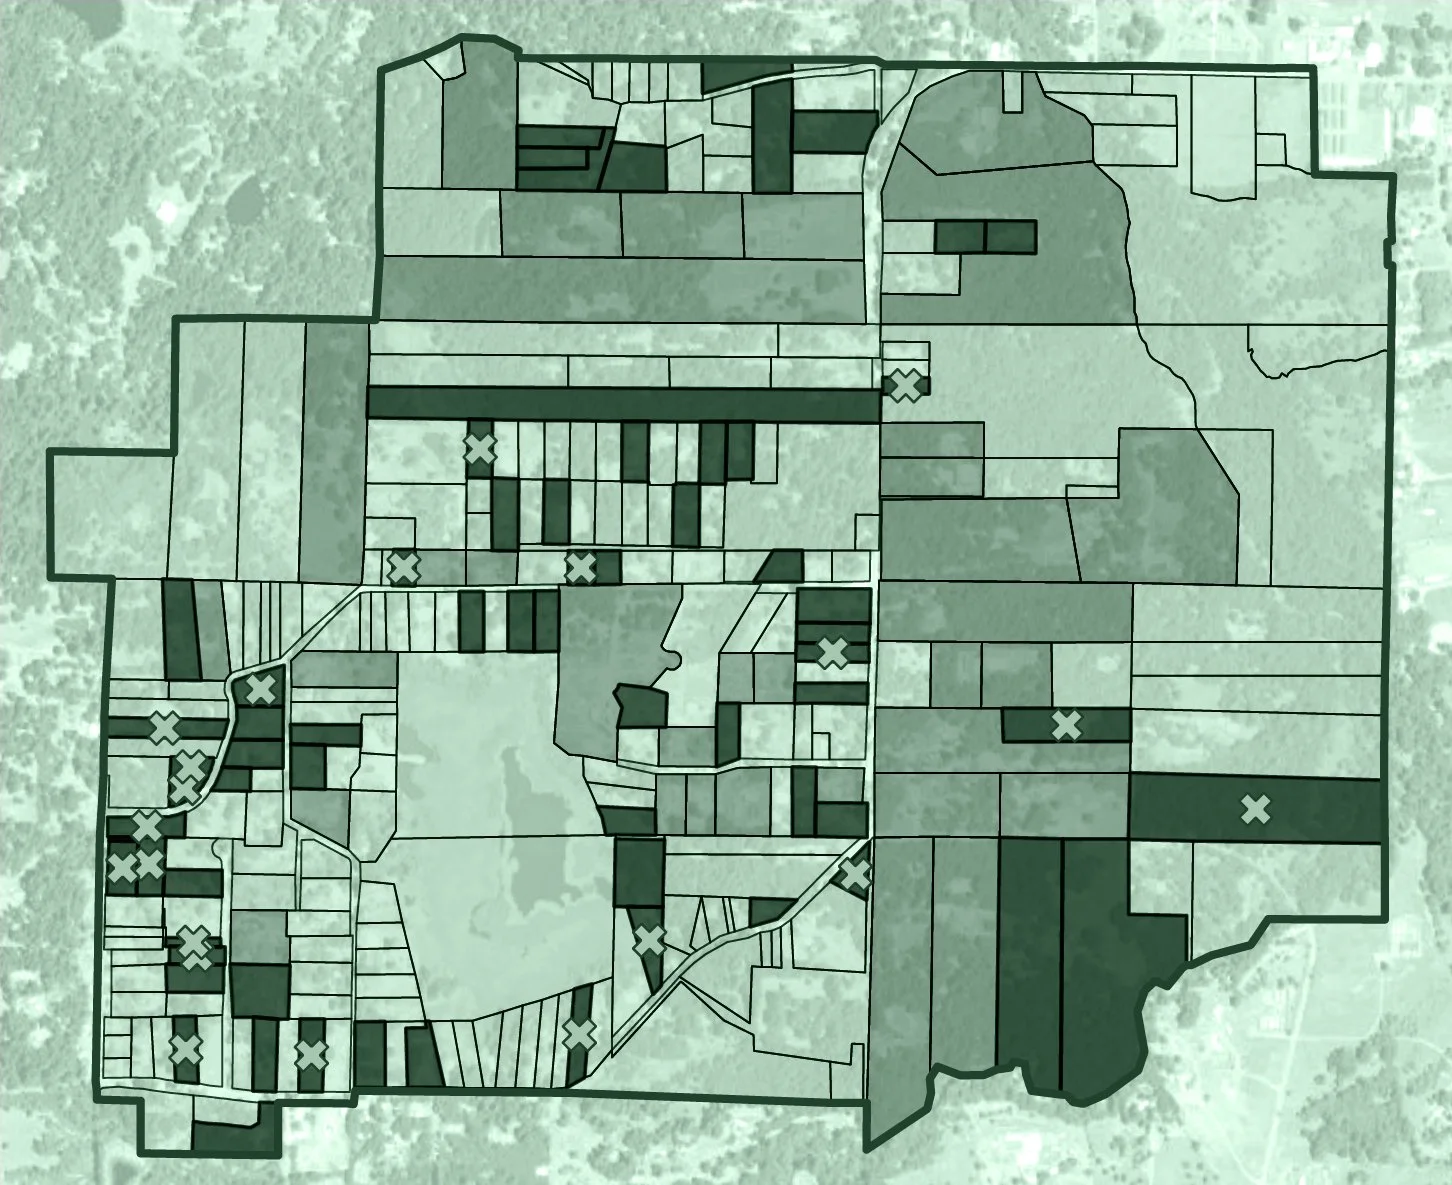
Recognizing the fundamental socioeconomic role cannabis cultivation plays for its communities, legacy growing jurisdictions drafted their local regulations to include special accommodations for pre-existing cultivators. In the ordinances it adopted starting in 2018, Mendocino County created a unique zoning mechanism allowing for the establishment of Cannabis Accommodation Combining Districts. Through a process functionally equivalent to a rezoning, neighborhoods with legacy cannabis cultivation could petition to have the special district overlaid on contiguous parcels of consenting property owners The combining district relaxed to 20 feet the otherwise required 100- foot setbacks between cannabis grows and residential structures on separate parcels and the 50-foot setbacks from property lines; with a discretionary land use permit, the property line setback could be absolved altogether. The County enacted four such districts in December 2018, thereby creating neighborhoods where commercial cannabis cultivation could remain uniquely integrated into the local landscape.
Having spent a disquieting amount of time researching local cannabis land use regulations, I find this whole situation rather intriguing. So, using Geographic Information Systems (GIS) -based methods, I set out to investigate: what would be the impact onto legacy cannabis cultivation in these combining districts if not for these special accommodations?
See the this issue of URBAN Mag here.
Above Boston: Remote Sensing, Landsat, and Urban Change
Since its commencement by the United States Geological Survey (USGS) and the National Aeronautics and Space Administration (NASA) in 1972, the Landsat program has launched seven Earth-orbiting satellites that have continuously collected electromagnetic imaging of the Earth’s surface, passing over every point on Earth every eight days. The expansive spatio-temporal scale of Landsat’s monitoring allows the production of remotely-sensed datasets particularly well-suited to observing change on the Earth’s surface over time in diverse applications, including agriculture, forestry, and ecological monitoring.
This project employs Landsat data covering the City of Boston, MA at four points in time so as to tell a story of urban change. Each scene is represented with four different combinations of raster bands, including both visible and invisible wavelengths, and a GIS-based change detection methodology is utilized in order to identify sites of urban change occurring between the known points in time. The various analytic maps are organized using an “experimental representational strategy” that prioritizes the sites of urban human intervention. Yet in so doing, the representation subverts the idea that Landsat can fully capture the creative, destructive, and transformative processes that truly influence the lived experiences of grounded urban subjects. While its view is omniscient, as well as spatially and temporally vast, Landsat and similar infrastructures are incapable of replacing “the inductive and deductive processes people use to make sense, for themselves, of the complex conditions in which they live.”
Click here to view the full project documentation.


Wisconsin 2016: Identifying Breaches in the Democratic Blue Wall
In the 2016 US presidential election, the so-called Democratic “Blue Wall” of Midwestern states was breached. Despite having consistently voted for Democratic presidential candidates in the last decade, Wisconsin voted in favor of Donald J. Trump in 2016 by a margin of just over 22,000 votes, the slimmest margin across all states that year.
While an abundance of writing and testimony identify critical failures of the 2016 Democratic campaign strategy, this report focuses on utilizing advanced spatial analysis to identify specific geographic areas in Wisconsin that show potential for improved Democratic outcomes in future presidential elections. This is achieved by constructing a geographically weighted regression (GWR) model which successfully predicts a victory in Wisconsin for Secretary Clinton based on numerous political and demographic indicators of Democratic vote by ward. These predictions are then statistically compared against the observed election results to identify under-performing wards that could be targeted in future campaigns to improve the success of Democratic presidential candidates. Focusing on Wisconsin Congressional Districts 1, 2, 4, and 5, the methodology successfully identifies nearly 50 percent of the votes the Clinton campaign would have needed to claim victory in Wisconsin in 2016.
Click here to view the full report.
Exploring the Spatial Distribution of Building Energy Use in New York City
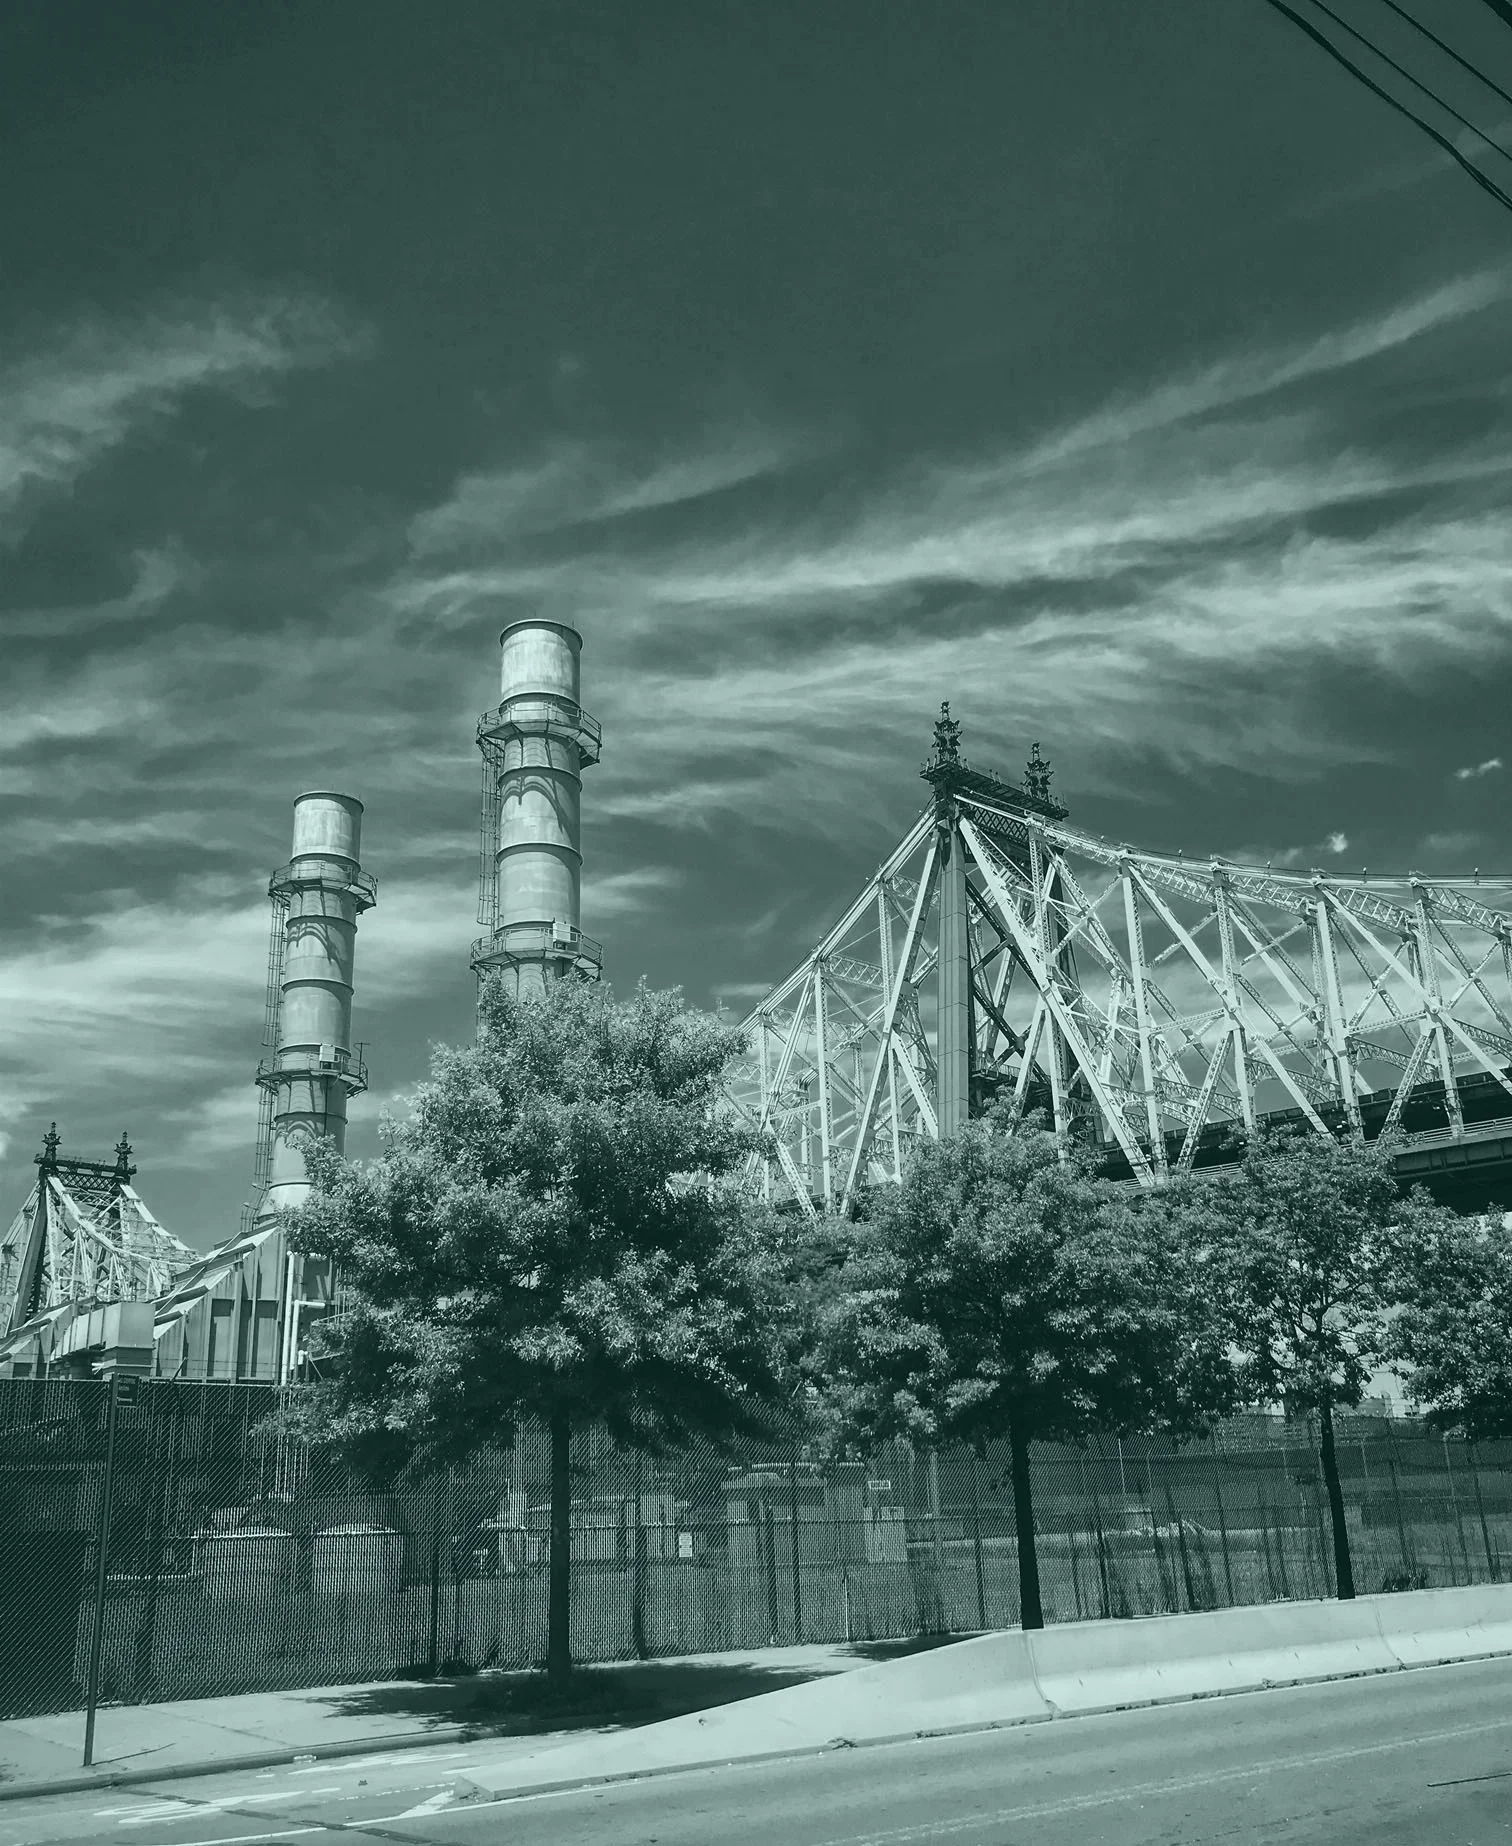
As climate change languishes as a politically-charged issue at the federal level, American cities are increasingly the primary governmental actors confronting its widespread implications. New York City is a case in point, having adopted an ambitious goal of reducing energy consumption by 80 percent by 2050. In NYC, two-thirds of energy consumption occurs in buildings, so increasing building energy efficiency represents a significant opportunity for achieving those goals. Recognizing the relationship between urban form and building energy consumption, this paper is guided by the question: are there significant spatial patterns of building energy consumption in New York City? The spatial analysis deployed here does indeed identify statistically significant clusters of building energy use that cannot be explained by land use patterns alone.
Click here to view the full report.